 In Part 1, and Part 2 of this series, we dove into the first thing you needed to do customer analytics well: getting ready access to a complete source of customer interaction data.
In today’s blog we’ll dive into the second major requirement: gaining access to a range of complementary data like demographics, BIN lists, ATM descriptions, etc.
While transaction data can be incredibly rich, sometimes the fields within it are cryptic. For example, the transaction data may contain a numeric ATM ID field, but it rarely contains the more user-friendly name of the branch where the ATM resides. Making sense of these cryptic fields takes time and is susceptible to user errors.
This is where technology can help us. What we’d like is for all the cryptic fields to be automatically replaced with helpful, user-friendly fields – often called metadata. By enriching raw transaction records with metadata, we get immediately useful information and we can eliminate the time and errors that result when we try to do all this manually.
Here are some examples of where metadata is nice:
- Replacing a BIN number (the first six digits of the credit / debit card) with the name of the institution that issued it: “519133” is replaced with “Bank of Montreal MasterCard”
- Replacing an ATM ID number with the location and type of an ATM: “ATM234” is replaced with “5th and Main, Drive Up”
- Replacing a response code number with its description: “91” with “issuer unavailable”
There is another layer of complementary data that can add to our analysis as well. This data adds more context to what we’re seeing in the transactional data. Contextual data includes things like:
- Overlaying income levels on our ATM fleet can help us understand why consumer behaviors might vary from region to region
- Inclement weather may affect the reliability of outdoor ATMs. It might also drive more people into shopping malls and increase usage of machines located there
- Local events may drive sudden demand patterns at particular machines, or change the average withdrawal amounts
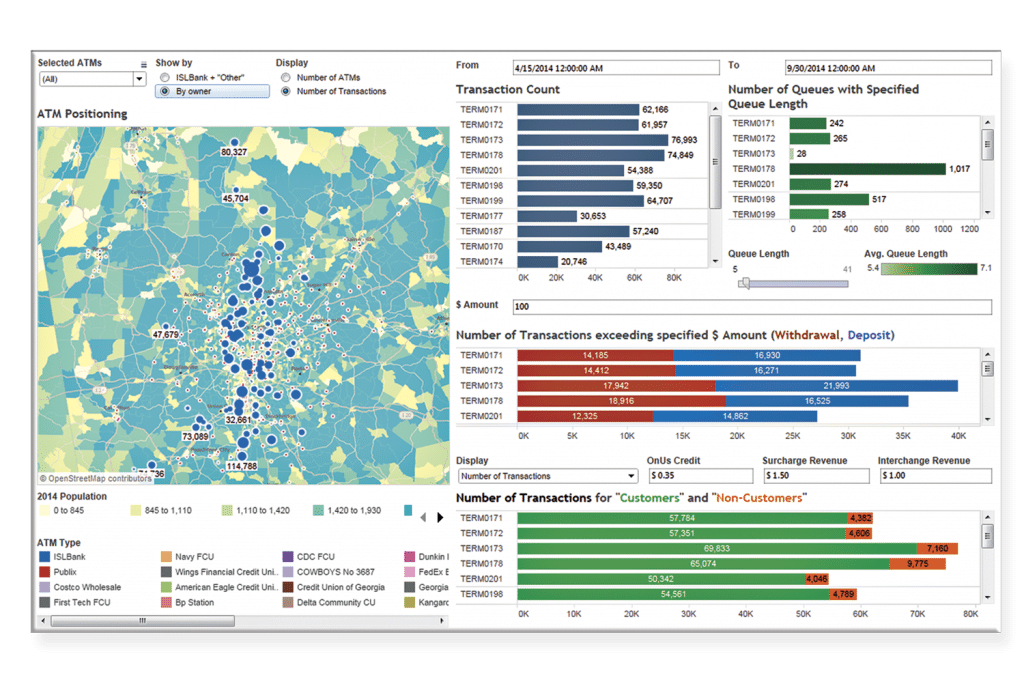
The technical challenge is that metadata and contextual data often reside in a variety of different systems, making it hard for analysts to bring it in an lay it alongside transaction data. Ideally, an analytics system should automatically blend all this data for you, like INETCO Analytics for ATM does:
In the final blog in this series, we’ll look at the tools you need to effectively navigate and visualize all this useful data.
Part 4 of the customer analytics series.
You can explore more about payment fraud analytics and how it integrates with customer interaction data on INETCO.


 English
 French
 Portuguese
 Spanish