In the release of INETCO Insight 5.2, we added a set of new transaction analytics that compliment existing ATM monitoring and self-service software management solutions by allowing you to see how all of your individual devices (such as ATM or POS terminals), authorization or switch hosts and card bases are performing. This new analytics view was added to give IT operations teams and ATM channel delivery managers more flexibility and insight into how their defined terminal groups, hosts and card types are performing. ATM and POS specific statistics displayed can include valuable information such as:
- The number of deposits or withdrawals on an ATM for a selected time period
- The number of transaction failures, approvals, declines, force posts and reversals on your hosts
- The number of transaction failures, approvals, declines, force posts and reversals on from your different card issuers.
When you log into the INETCO Insight transaction-centric application performance monitoring software, you can use the new analytics view by selecting the “Object Analytics” tab and selecting which category you want to view (i.e. Terminals, Host Links, or Card Types). The first thing that pops up is a list of the most recent analytics available for all of the objects you have configured:
If there is an object you are interested (say an ATM terminal where you have been alerted to having performance issues or transaction anomalies) you can use the “Quick Filter” to view analytics for only that ATM.
You can also “Set Time” button to change the time you are viewing. Here you can select to view your analytics up to 8 days in the past.
The columns in the list allow you to customize your view and sort by any column so you can quickly see your data in a way that makes sense to you.
We also wanted a way to highlight terminals or hosts whose performance behavior is outside the “norm”, so we added a feature where you can highlight the outliers for each of the columns. To turn this on, select the wrench button on the top right side and select “Use Standard Deviation for column thresholds”. You can scroll through the list and see the outliers quickly and do more investigation if necessary.
The other feature we included was the ability to view the historical trends. The “Object History” view shows all the available statistics for the selected object over the last 8 days.
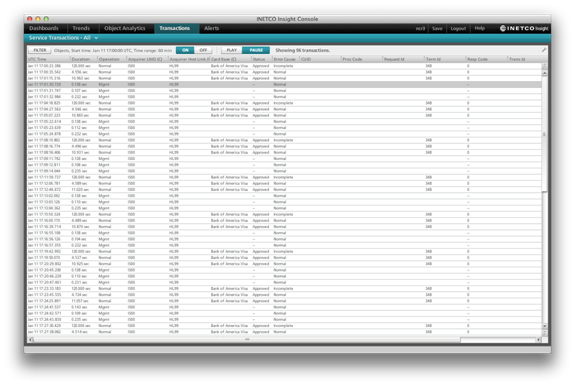
It is also important to be able to get to individual transaction-level detail quickly, so if there is a problem or issue you can isolate and investigate way faster (in fact, our customers report an average of 65-75% faster). By clicking on any row in “Object Analytics” view, you can open up the Object History view or the Transaction Log view to show the transactions for that time period for the selected object.

A helpful feature? We sure hope so. If you are interested in sharing your thoughts, or arranging for a demonstration of the INETCO Insight product, please don’t hesitate to contact us at insight@inetco.com.
You would also love to share with you a complimentary whitepaper we created titled: Thinking Beyond the ATM: How End-to-End Transaction Visibility Improves the Customer Experience


 English
 French
 Portuguese
 Spanish