In our last blog we talked about how fictitious card operations manager Cary Agos gets value from on-demand card analytics. This week we will focus on another imagined transaction data analytics user: Charlotte Tyrell, an ATM channel manager at a bank. Charlotte is known at the office for being the sharpest knife in the drawer. Part of her job is to report on the performance of the ATM fleet and identify new ways to improve channel profitability. This is information she shares with her boss, the director of the ATM fleet.

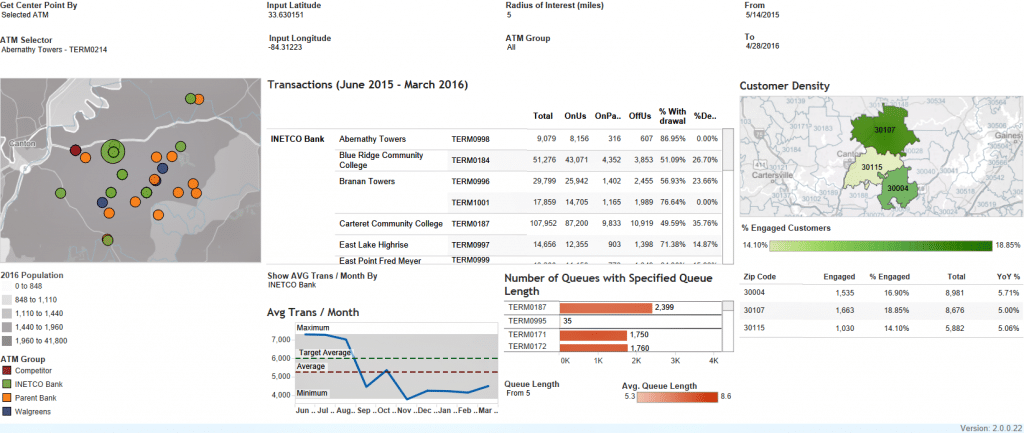
 At the top of Charlotte’s list of priorities is finding new ATM locations that will be both profitable and useful to the financial institution’s customers. Prior to her use of transaction data analytics, gathering, cleaning and aggregating the data she needed to make a new ATM location proposal was both time consuming and tedious, involving many expensive resource hours and business units. Now, using customized visualization dashboards that can integrate and update data on-demand, Charlotte can quickly access the timely information she needs to make a well informed placement decision. Take, for example, her most recent proposal:
 Charlotte was alerted that a group of ATMs in a new suburb were at high volume and near capacity during peak hours. Using her dashboard, she saw that terminal 0187 in this area frequently had queues of over 5 people and had processed 107,952,000 transactions over the past 10 months – With 80% of those transactions being done during peak hours. This was well above fleet average of 7000 transaction per month. Charlotte was also able to determine, using zip code information tables blended with her real-time transaction data feed, that the suburb where terminal 0187 was contained is a hotspot for new customer acquisition, and was becoming home to a growing percentage of their most engaged, “gold level” customers. In order to support this growth and provide more convenient ATM services for their customers, Charlotte knew that her bank should consider adding another ATM, before their competitors beat them to it.

Next, Charlotte determined that drive-up ATMs in this area were preferred by customers given their higher transaction volume compared to standard walk-up kiosks. Charlotte was also able to see the on-us vs. off-us transaction breakdown which helped her estimate the potential revenue a drive-up ATM in that area could generate. From there, it was simple, based on transaction volumes, the value customers would see given a secondary ATM option, and a simple analysis of how many transactions were needed to break even, that adding another drive-up ATM made sense. Charlotte used dashboard screenshots to create a rock-solid ATM proposal backed up by insightful data.
Prior to her use of transaction data analytics, creating an ATM placement proposal such as this could take Charlotte 8 to 10 working hours. Now, the same proposal only takes 2 hours. In addition, she no longer has to rely on her IT department to send her the data, as it’s easily available to her on-demand and in real-time.
Want to become more like Charlotte? Contact INETCO to discuss transaction data analytics.

