[youtube]http://www.youtube.com/watch?v=9JWIE88pmVw&list=UU4_ik_RVWz0HkTeaqz7d7EQ[/youtube]
Have you ever found yourself asking, “Why is a particular application slow?” or “how is application performance impacting us?”
If you’re in Application Management you know that maintaining and supporting large-scale, distributed applications can be extremely challenging. You want to understand the user experience, how each tier is performing and be able to quickly isolate the likely source of problems. Splunk has all the raw capabilities to help you here, but you’ve still got to get the data in to begin with.
Imagine you’re running an e-commerce website. You’ve got web servers, application servers, interfaces to middleware or ESBs, database connections, and calls to a whole host of third party web services. Some of these components (e.g. your IIS or Apache web servers) have pretty good error logs that can be turned on with little effort and limited performance overhead. You might even take a bit of a performance hit and ask Apache to compute request times. But, when you start to try to get data from other components, like your ESB or your database, things start to get complicated. Availability data may be readily accessible, but the detailed request information that you can get from Apache logs is a lot harder to come by. Simply put, most backend application components don’t log very well.
Watching Splunk super users try to get around this challenge by writing extensive custom application logs and scripts made us go, hmmm…
More specifically, we thought, “what would happen if we could make transaction event data available to ALL the Application Management and Support people using Splunk, not just those with the time (and budgets) to build custom logs and scripts. How can we turn all App Support teams using Splunk into ‘super users’.”
And the idea behind INETCO NetStream was born.
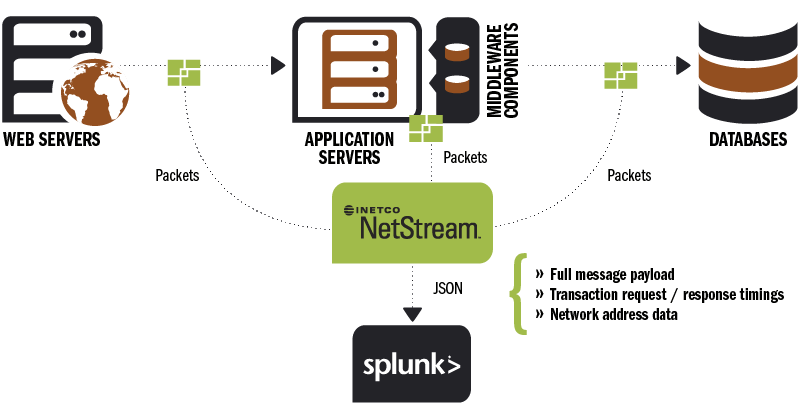
Now imagine that you can get not just end-to-end response time, but hop-by-hop response times for each tier of your application:
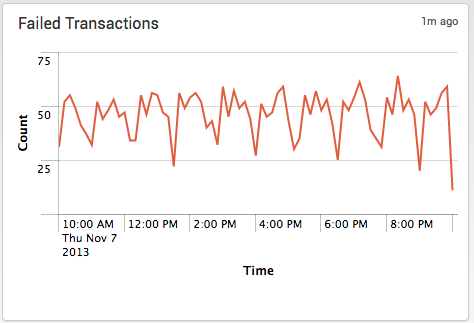
Imagine that you can quickly distinguish between successful and failed transactions, not by sifting through Apache error logs, but by seeing a graph of “failed” transactions:
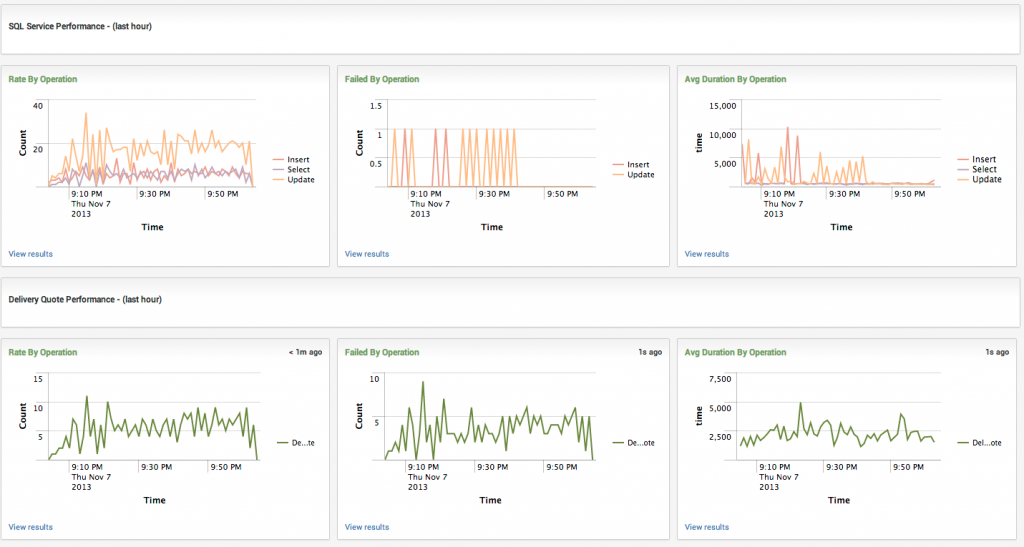
Imagine you can see the performance of every tier of your distributed application:
Finally, imagine you could measure the performance of specific transactions that matter to the business:
We’re building INETCO NetStream to allow application support teams to instantly identify when any critical application (including third party applications and those residing in virtual environments) appear to be running slow or not responding. By placing INETCO NetStream collectors on either a SPAN/TAP port or on a server you can tap into the real-time stream of transactions that are moving between your critical applications. INETCO NetStream will consistently capture and extract data such as full message payloads, response/request timings for different parts of an application stack, and network address data for each transaction, to help you measure the health of all your individual application components.

With INETCO NetStream you can take all of your http, XML, SQL and AMQP traffic, and run a filter to access which information is most important to you – actionable event data and payload information like transaction duration, application/server response times, application/server request times, or response code errors. You can then decide what information from the application payload is going to help you the most (for example, it could be transaction status, terminal IDs, attempted purchases that took over X minutes to complete, or number of login tries that failed). That data can then be imported into Splunk, so that you can determine what “normal” baseline profiles of application performance response and request times look like.
From there, you can start looking at business activity monitoring, how user experience is being affected by application performance (ie: too many attempted logins or incomplete purchases) and easily measure the business impact of performance issues such as website response slowdowns. This is the type of information that will help you reduce the time, resources and effort it takes to establish a complete view into all critical applications, and quickly isolate application slowdowns or failures across multiple components. And INETCO NetStream provides you with this operational intelligence without you having to ask (beg) for access to log files or having to create custom scripts. It’s provided automatically once you’ve simply downloaded and set up the app.
INETCO had so much fun talking to everyone at Splunk Conf2013 that we’re back again sponsoring Splunk Live New York. If you’ll be there and are interested in learning more about INETCO NetStream, please come by to visit me and Marc Borbas, our VP of Products, at our booth. You’re also invited to sign up to our free INETCO NetStream beta and we’ll even bring t-shirts to Splunk Live for those that do.

And if you can’t make it to the event, you’re still invited to sign up for the INETCO NetStream beta. Your shirt will just be sent via snail mail instead 😉


 English
 French
 Portuguese
 Spanish