We all know that monitoring business transactions and application performance can be a painful experience if the tools used don’t allow the flexibility to view the data you need to see, in a format that makes it possible to:
- quickly access the granular transaction intelligence you need,
- make timely decisions, and
- take immediate action.
After spending the past six months studying our customer’s workflows, the INETCO R&D team is set to deliver some pretty slick ways that will enable our users to move more intuitively and quickly between monitoring live dashboards, exploring historical trends and drilling into the transaction level details they need to do their jobs.
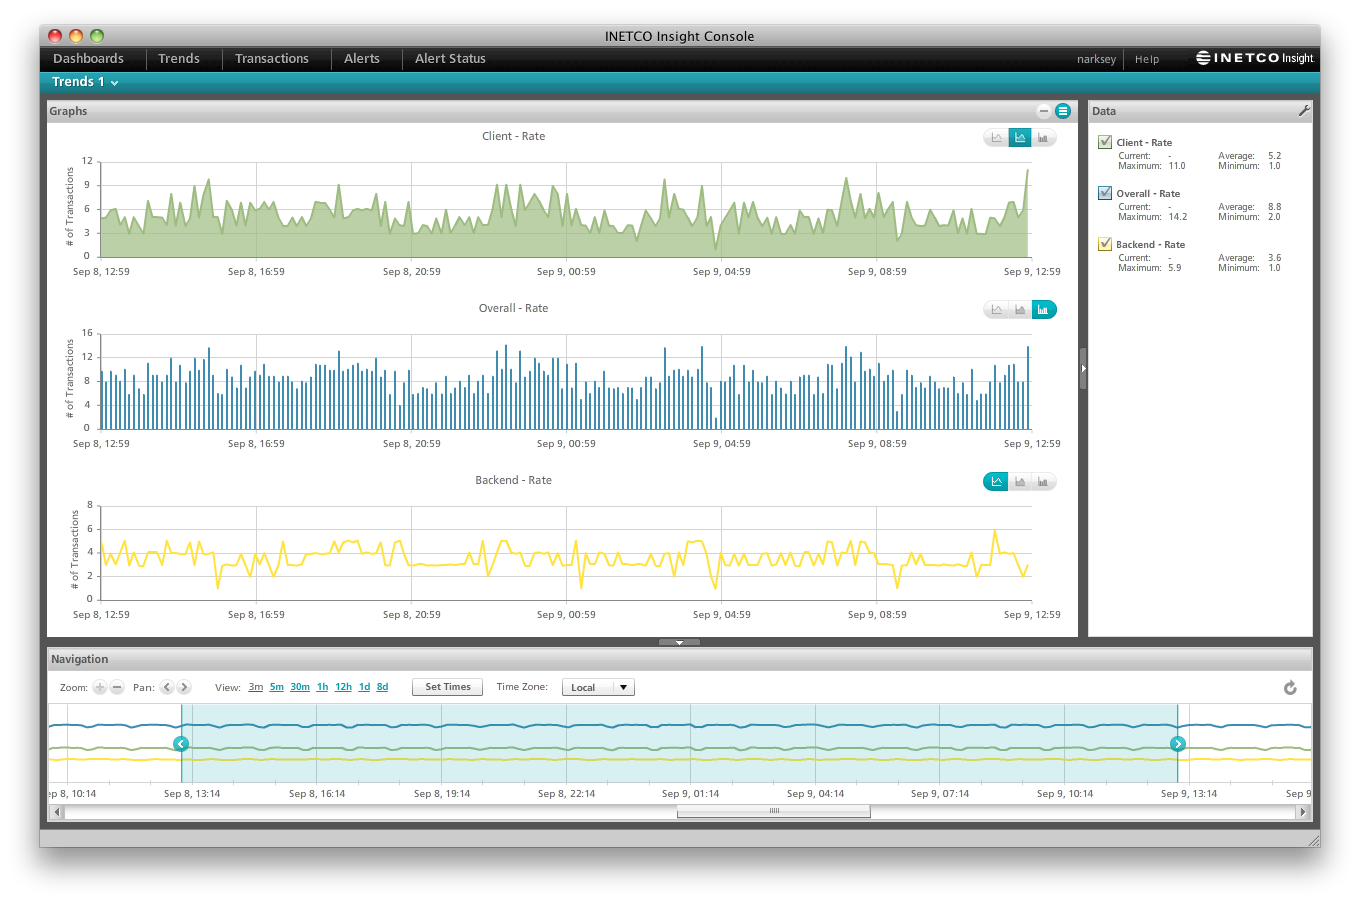
In the upcoming release of INETCO Insight 5, scheduled for Q1 – 2012, we have improved the way users are able to build up their own dashboards to view their data in real-time. In addition to advanced real-time monitoring, users will also have the ability to view data sliced and diced in many different ways, including real-time speedometers, pie charts, histograms, bar charts and line charts.

We have also added a configurable health check widget, where users can quickly see how well their networks are running based on the personalized metrics that are important to them.

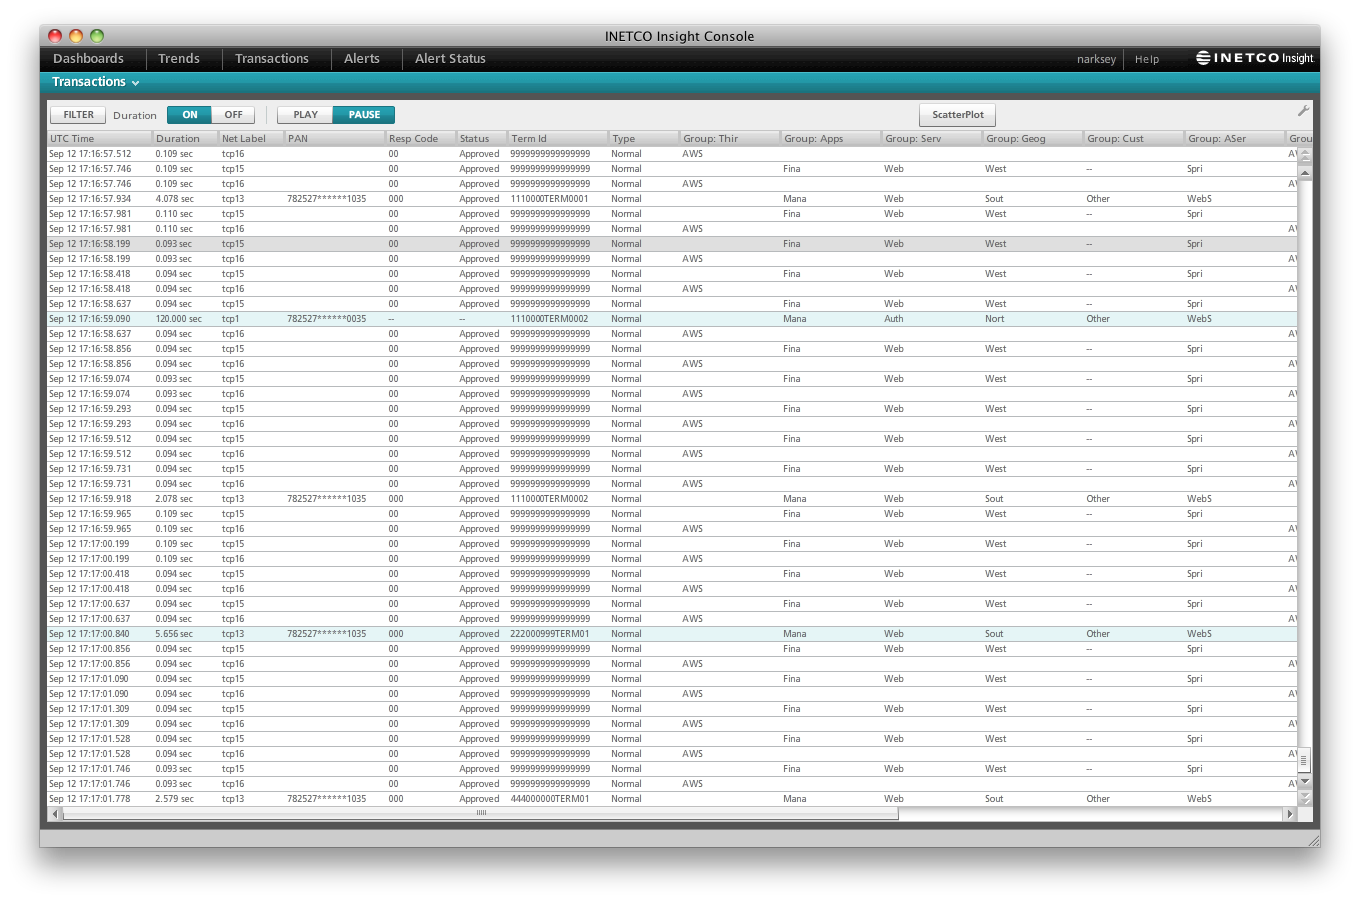
Along with new data visualization techniques, INETCO Insight 5 will have a new and improved workflow between real-time views, transaction details and historical data. This means that from any real-time chart, users can instantly retrieve the transaction details making up this chart, or open an eight-day historical view of the data displayed in the chart. Instantaneous viewing of transactional data allows users to get to the details they need and better understand what is happening on their networks, while viewing the historical data allows users to gain a better understanding of how their networks have been performing over a longer period of time. Once in the historical and transaction view, users have the flexibility of adding new metrics, filtering data and changing time periods to better get to the source of their network issues.


By ensuring visibility into your business transactions, the next product release of INETCO Insight will make understanding your application performance easier than ever before!
If you are interested in a sneak preview of the INETCO Insight 5 UI, watch this YouTube video:
[youtube]http://www.youtube.com/watch?v=bhFQ5xWjVTQ[/youtube]


 English
 French
 Portuguese
 Spanish